
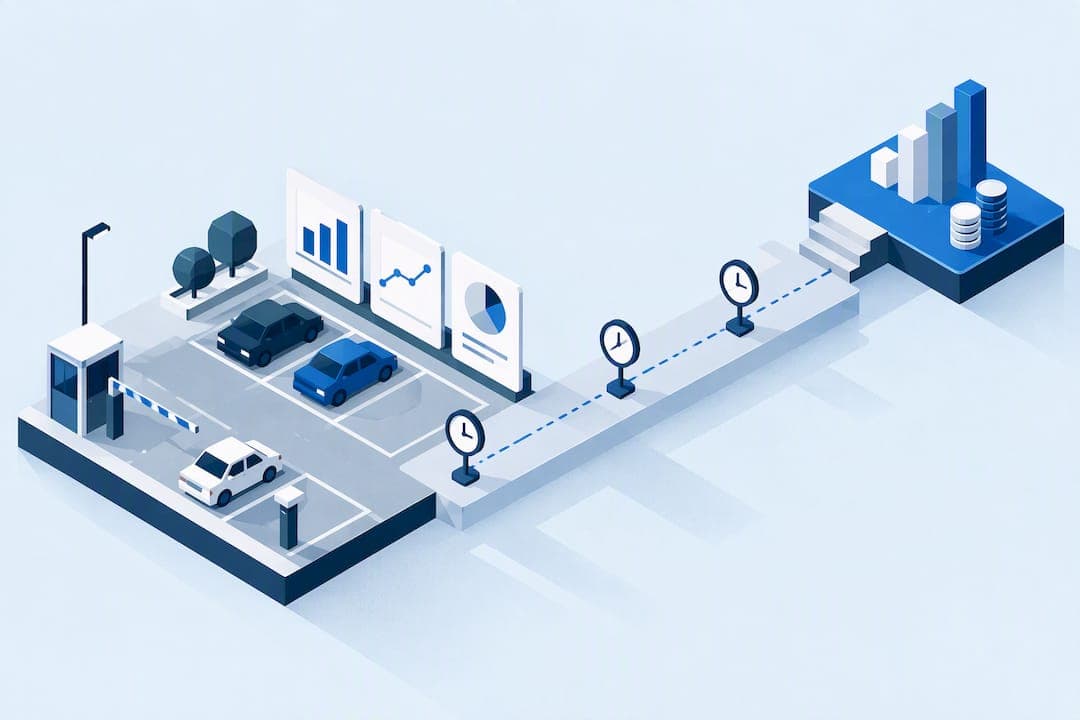
Parking data analytics delivers better space utilization, higher recoverable revenue, and more efficient enforcement when occupancy, length of stay, and transaction data are combined and kept clean. The three data types work together: occupancy tells you how full a facility is, length of stay tells you how it is being used, and transaction records tell you what it earns. None of that matters if the feeds are not integrated and validated first.
TL;DR:
- Occupancy rate at the zone level and length of stay are the most critical metrics, directly informing pricing, staffing, and enforcement decisions.
- Achieving accurate data relies on an integrated system supporting APIs, open formats like CDS, and validation through manual counts during pilot phases.
- Real-time occupancy and transaction data enable AI-driven automation, reducing vehicle search times by up to 32% and improving space utilization by 21%.
- Data feeds from sensors, cameras, and payment systems need regular reconciliation to prevent inaccuracies that can undermine analytics insights.
- A unified platform that consolidates permits, violations, payments, and reporting simplifies operations and enhances decision-making efficiency.
Table of Contents
- What parking data analytics means for daily operations
- Key metrics and KPIs worth tracking
- Where the data actually comes from
- Turning raw counts into decisions: analytics methods that matter
- Putting analytics to work: pricing, enforcement, staffing, and events
- Where the numbers go wrong
- From pilot to full deployment: a practical roadmap
- How an integrated platform supports the analytics lifecycle
- Who is actually using the lot: behavior and segmentation
- Parking analytics beyond the lot: urban planning and sustainability
- What is changing next: AI and IoT in parking analytics
- Practical priorities for managers starting out
- A practical next step for operators ready to consolidate
- Sources
- FAQ
What parking data analytics means for daily operations
Parking data analytics, in practical terms, is the process of turning sensor, payment, and permit records into reports and alerts that a manager can act on the same day. It is not a research exercise. It is a working layer between raw counts and the decisions that keep a facility running at the right price and the right staffing level.
The outputs that matter most to operators tend to fall into a few recurring formats:
- Occupancy maps and heatmaps showing which zones or levels fill first and when.
- Turnover tables that break down average length of stay by entry time or rate type.
- Daily revenue summaries split by payment channel (cash, card, mobile app, validation).
- Exception alerts flagging overstays, unpaid sessions, or sudden occupancy drops that suggest a sensor fault.
Operations staff use occupancy maps to decide where to direct incoming traffic. Enforcement teams use turnover tables and overstay alerts to prioritize patrol routes instead of walking a lot at random. Finance teams reconcile the daily revenue summary against bank deposits and flag discrepancies before they compound into a monthly accounting problem. The City of Berkeley's RFP for parking data analytics services lists exactly this kind of output, requiring maps, graphs, and CSV or Excel reports of occupancy, length of stay, and revenue as standard deliverables for any vendor proposal, which gives a useful benchmark for what a functioning analytics program should produce.
Key metrics and KPIs worth tracking
Not every number a sensor produces is worth a dashboard tile. The metrics below are the ones that tie directly to a pricing, staffing, or enforcement decision.
- Occupancy rate, measured at both the space level and the zone or block level, compared against a target utilization band rather than a simple full/empty count.
- Length of stay and turnover rate, calculated as total parked hours divided by available space-hours, which shows how many times a space effectively changes hands in a day.
- Revenue per space-hour, a normalized figure that lets you compare a surface lot against a garage regardless of size.
- Transaction mix, which payment channels and rate types generate the most revenue and which generate the most disputes.
- Search time and cruising behavior, an indicator of how much traffic is circling for a space rather than parking directly.
Field trials of an IoT-enabled, cloud-integrated smart parking system reported a 32% reduction in average vehicle search time and a 21% improvement in space utilization when real-time monitoring was paired with AI-based optimization, according to a TRID-indexed study of a cloud-integrated smart parking system. That gap between search time and utilization is the clearest evidence that monitoring alone does not fix a facility: the gains showed up only once the system acted on the data.
For a quick "is this lot full" heuristic during events or peak demand, FHWA's planning checklists describe a pipeline capacity method: available capacity minus current vehicle count minus pipeline capacity (the queue of vehicles still approaching, estimated from queue length divided by average vehicle spacing) tells you whether to close the gate or keep accepting cars, a detail covered in FHWA's site access and parking planning checklists.
Where the data actually comes from
Every analytics program is only as good as its weakest feed, and parking facilities typically blend several at once.
- Per-space sensors (in-ground loops or pucks) give the most precise occupancy data but carry higher installation and maintenance costs over a large facility.
- Camera and computer vision systems cover whole zones at once and can read plates, but accuracy depends on lighting, angle, and how often the system captures a frame.
- Meters and mobile payment platforms generate transaction-level data automatically, though they only capture paid sessions, not actual occupancy.
- License plate recognition (LPR/ANPR) supports enforcement and length of stay tracking but needs a clean inventory to match plates to permits.
- Third-party mobile and navigation feeds add contextual demand signals but rarely cover an entire facility on their own.
The core trade-off across all of these is detection frequency versus cost. A snapshot camera that captures an image every few minutes is cheaper to run than a streaming sensor, but it will miss short events, a limitation documented in municipal pilots and discussed further below. Connectivity also matters: a facility with weak cellular coverage will see gaps in any wireless sensor feed regardless of the hardware's rated accuracy.
Interoperability is where many programs stall. Bringing sensor, payment, and permit data into one view requires API ingestion rather than manual spreadsheet exports, and increasingly that means supporting the Curb Data Specification (CDS) so that occupancy and transaction feeds can be shared with city systems or third-party analytics tools without custom integration work each time.
Pro Tip: Before signing a hardware contract, ask the vendor for their documented API schema and confirm it supports CDS or a comparable open format, not just a proprietary export.
Turning raw counts into decisions: analytics methods that matter
Dashboards are the starting point, not the destination. A useful analytics stack layers four kinds of analysis on top of the raw feeds.
- Descriptive dashboards and scheduled reports show what happened yesterday or last week: occupancy by hour, revenue by day, overstay counts by zone.
- Diagnostic analysis digs into why a number moved, for example tracing a sudden occupancy drop to a closed entrance rather than a real demand shift.
- Predictive models forecast short-term occupancy so a manager can anticipate a Friday evening peak rather than react to it. Spatial-temporal approaches, including graph-based and transformer models, have shown stronger performance than simple time-series forecasts in on-street contexts according to research on transformer-based parking occupancy prediction, which matters for facilities near commercial corridors with uneven demand patterns.
- Operational automations close the loop by triggering an action directly: an overstay alert that assigns a patrol task, or a predicted peak that triggers an extra staff shift.
The jump from descriptive to predictive is where most facilities get stuck, often because the historical data is not clean enough to train a reliable model. That is a data quality problem before it is a modeling problem, and it is worth solving in that order. A facility that nails descriptive reporting and diagnostic review, even without forecasting, still gets most of the operational benefit: clear information about what happened and why is often enough to adjust pricing or staffing within a week rather than waiting on a quarterly review.
Putting analytics to work: pricing, enforcement, staffing, and events
Analytics only pays off once it changes a decision. Four areas see the most direct impact.
- Demand-responsive pricing: Occupancy and turnover data identify which zones consistently run above target utilization, supporting a rate increase there and a discount in underused zones instead of a flat facility-wide rate.
- Targeted enforcement: Length of stay data flags vehicles exceeding posted limits, letting a patrol officer check three known overstays instead of walking an entire garage looking for violations.
- Staffing and gate scheduling: Predicted peak hours, drawn from historical occupancy patterns, support shifting a staff member's schedule to cover a Saturday morning rush instead of a quiet Tuesday afternoon.
- Event management: Pre-booking rules and temporary event rates, combined with the pipeline capacity heuristic described earlier, help a facility decide in real time when to stop accepting vehicles rather than overfilling and creating a backup at the gate.
Active management of this kind, where analytics actively shapes trip decisions from origin to destination rather than passively recording them, reduces congestion and improves enforcement efficiency according to FHWA's active parking management guidance. The common thread across all four use cases is the same: the data only creates value when it is tied to a specific person's task, whether that is a pricing committee, a patrol route, or a staffing schedule.
Where the numbers go wrong
Every analytics program eventually runs into a data quality problem, and it is worth knowing the common ones before they undermine a report.
- Short-duration events are easy to miss. Snapshot or solar-powered cameras that capture images every few minutes can miss events under four minutes entirely, a limitation documented in the San José SMART Curbs pilot, which found that hardwired streaming devices with improved AI detection were needed for comprehensive event capture.
- GPS-based cruising analysis needs map-matching, not raw pings. Comparing a vehicle's path against the road network, rather than treating pings as isolated points, is necessary to tell driving from parking, a methodology detailed in FHWA's parking cruising analysis report.
- Feeds drift out of sync with reality. Sensor counts, payment records, and physical inventory need periodic reconciliation, since a single broken loop detector can silently skew a month of occupancy data.
Large-scale pilots that started with an accurate, validated space inventory (a digital twin) avoided the long integration delays that undocumented deployments ran into, according to the San José SMART Curbs pilot. On governance, keep access role-based, anonymize data tied to individual plates before sharing it outside enforcement, and set a retention schedule rather than storing raw location data indefinitely.
From pilot to full deployment: a practical roadmap
Scaling an analytics program works best as a staged process rather than a single large rollout.
- Scope the pilot around one or two KPIs, a defined zone or facility, and a duration of three to six months, long enough to see a full demand cycle including at least one event or holiday peak.
- Establish ground truth by running manual counts or staff observation sessions during the pilot and comparing them against sensor output to catch systematic errors early.
- Set a reconciliation cadence, weekly at minimum, comparing occupancy, payment, and permit records against each other rather than trusting any single feed in isolation.
- Define scaling triggers in advance: a data completeness threshold (for example, no more than a small, named percentage of missing readings per day) and confirmed API integration with your core management platform before expanding to additional sites.
- Plan the operational handoff: decide the reporting cadence for each team, whether any data becomes public-facing, and what staffing or enforcement changes take effect once the system moves from pilot to standard operation.
Pro Tip: Run your ground-truth validation during both a weekday and a weekend shift. Occupancy patterns and detection errors often look different across the two, and a pilot validated on weekdays alone can miss weekend-specific sensor gaps.
How an integrated platform supports the analytics lifecycle
Most of the friction in parking analytics comes from reconciling data across disconnected tools: one system for permits, another for payments, a spreadsheet for violations. A unified record system removes that reconciliation step by design.
MyParkingMgr ties permits, violations, payments, and historical vehicle records into one dataset, which means a length of stay report and a payment reconciliation draw from the same source instead of two exports that have to be manually matched. For an operator managing several properties, multi-property reporting gives one portfolio view rather than a separate login and separate report for each site.
- Unified records linking guest access, permits, and violations to a single vehicle history.
- Multi-property portfolio reporting for operators managing more than one site.
- Payment reconciliation built into the same workflow as violation and enforcement tracking.
- Configurable deployment as hosted SaaS, client-hosted, or white-label, depending on an operator's infrastructure needs.
Who is actually using the lot: behavior and segmentation
Occupancy and transaction data get more useful once they are split by who is generating them, not just when. A facility serving a mixed tenant base, say an apartment community with a retail ground floor, will show very different usage curves for residents, guests, and vendors, and treating them as one undifferentiated pool hides the actual pressure points.
Segmenting by user type typically falls into a few natural categories: resident or tenant parkers with recurring overnight patterns, short-term visitors or guests with daytime or event-driven spikes, vendors and delivery vehicles with brief, frequent visits, and transient or public parkers paying by the hour. Each group has a different tolerance for price changes and a different enforcement need. A resident overstaying a visitor spot is a permit issue; a vendor blocking a loading zone for two hours is an enforcement issue; a daytime spike from an adjacent retail tenant is a capacity planning issue.

Length of stay distributions are often the clearest segmentation tool available without added hardware, since a payment or permit system already timestamps entry and exit. Grouping stays into short (under an hour), medium (a few hours), and long (overnight or multi-day) bands, then cross-referencing each band against the payment or permit type used, usually surfaces which user group is actually driving a facility's peak occupancy, which is not always the group a manager assumes it is.
Parking analytics beyond the lot: urban planning and sustainability
Parking data does not stay inside the facility fence line. Cities increasingly fold occupancy and utilization data into broader planning decisions, and operators who generate clean data become a more useful partner in those conversations.
Open municipal datasets, like the San Diego parking study occupancy dataset, publish hourly occupied counts and percentage occupancy fields precisely so planners can see where demand concentrates without installing new infrastructure. That kind of data informs decisions about whether a neighborhood needs more parking capacity or less, and whether curb space might serve better as a loading zone or bike lane at certain hours.
The sustainability angle follows directly from the cruising research. Reducing the time vehicles spend circling for a space cuts fuel use and local emissions without requiring a single new parking space, which is part of why FHWA treats cruising reduction as a core goal of active parking management rather than a side benefit. For an individual operator, feeding accurate, API-accessible occupancy data into a municipal system (often through a CDS-compatible feed) is a low-effort way to support that broader planning work while also meeting the kind of data-sharing requirement that now shows up in municipal RFPs and curb management grants, such as the inventory and API work documented in a Minneapolis curb management SMART grant project.

What is changing next: AI and IoT in parking analytics
Two trends are reshaping what is practical for a mid-size operator, not just large municipal systems. The first is the spread of IoT sensor networks cheap enough to deploy at the space level across an entire garage rather than sampling a handful of spaces, which is what has made real-time, space-level occupancy data increasingly standard rather than a premium feature.
The second is AI-based optimization layered on top of that real-time data. The same field trial that found a reduction in vehicle search time and improvement in space utilization through an IoT-enabled, cloud-integrated smart parking system demonstrates the pattern: sensors alone generate data, but AI-based routing and allocation is what converts that data into a measurable behavior change for drivers. Similarly, transformer and graph-based forecasting models are starting to replace simpler time-series approaches for occupancy prediction, particularly where demand is driven by nearby commercial or event activity rather than a steady daily rhythm, a shift documented in the spatial-temporal parking occupancy research referenced earlier.
For an individual facility, the practical takeaway is not to wait for a flagship AI system. Starting with clean, well-integrated occupancy and transaction data today is what makes any future forecasting or automation layer useful once an operator is ready to add one.
Practical priorities for managers starting out
Start a pilot with clean data and a short KPI list, not a long one. Three well-validated metrics beat ten noisy ones, and most of the early value in parking analytics comes from fixing a bad feed, not from adding a smarter model. Favor API-first integrations and a validated space inventory before scaling to a second site: integration debt compounds fast across a portfolio. Finally, judge success by what changed operationally, revenue recovered, enforcement hours saved, reduced cruising, not by how polished the dashboard looks.
— MyParkingMgr
A practical next step for operators ready to consolidate
Most of the friction described throughout this guide, mismatched feeds, manual reconciliation, separate tools for permits and violations and payments, disappears when those functions live in one system instead of several. MyParkingMgr brings multi-property reporting, guest and vendor permits, violation tracking, and payment reconciliation into a single record set, with enforcement workflows tied directly to the same vehicle history your analytics already depend on.
- Multi-property portfolio reporting for operators managing several sites from one view.
- Configurable workflows and deployment as hosted SaaS, client-hosted, or white-label.
- Free onboarding included when you get started.
If your facility's usage data still lives across three disconnected tools, request a MyParkingMgr demonstration to see how one system handles permits, violations, payments, and reporting together. For operators weighing how occupancy data affects overall property performance, this overview of multifamily operating expense benchmarks is a useful companion read.
Sources
- FHWA — Parking Cruising Analysis Methodology: Final Project Report
- San José SMART Curbs pilot summary
- City of Berkeley — Parking Data Analytics Services RFP
- IoT-enabled cloud-integrated smart parking system (TRID)
FAQ
What is parking data analytics used for?
Parking data analytics turns occupancy, length of stay, and transaction records into reports that guide pricing, enforcement, and staffing decisions. It helps managers see which zones are overused, which overstay patterns need patrol attention, and where revenue is slipping between payment channels.
What metrics should I track first?
Start with occupancy rate at the zone level, length of stay and turnover, and revenue per space-hour, since these three tie most directly to pricing and staffing decisions. Add search time or cruising metrics once the core three are validated and reporting consistently.
How accurate are parking sensors and cameras?
Accuracy depends heavily on the capture method: snapshot or solar-powered cameras can miss short events, including many under four minutes, according to the San José SMART Curbs pilot. Streaming, hardwired devices paired with improved detection models close much of that gap but add cost and installation complexity.
How long should a parking analytics pilot run?
A pilot typically runs three to six months so it captures at least one full demand cycle, including a weekend and an event or holiday peak. That window gives enough ground-truth comparisons to validate sensor accuracy before scaling the program to additional sites.
Can one platform handle permits, violations, and analytics together?
Yes. MyParkingMgr unifies guest access, permits, violations, and payment records into a single system so analytics draw from one consistent dataset instead of several disconnected tools, with deployment available as hosted SaaS, client-hosted, or white-label.